Kong 0.12.3 是最后一个以 API 形式组织接口的版本,后续的版本中 Kong 新增了 Service 和 Route 的概念,对于插件的应用规则更加复杂,当然也更为灵活。不过就我个人而言,我更喜欢直接以 API 的形式来管理接口,简单粗暴,所以也就用 0.12.3 这个版本多一些。
然而这个版本当开启 bot-detection 插件的时候会有比较严重的内存泄漏问题。不过,复现这个 Bug 有两个前提:
- OpenResty 需要配置多个 worker,对应 Kong 配置:
nginx_worker_processes db_cache_ttl必须配置为 0,也就是让 Kong 的缓存永不过期
满足上面的条件之后,我们为 Kong 添加一个 API 并配置一个全局 bot-detection 插件:
curl -i -X POST \
  --url http://localhost:8001/apis/ \
  --data 'name=test-api' \
  --data 'uris=/foo' \
  --data 'upstream_url=http://127.0.0.1'

curl -i -X POST \
  --url http://localhost:8001/plugins/ \
  --data 'name=bot-detection'
接下来通过 ab 压测这个 API:
ab -k -c 1 -n 1000000 http://localhost:8000/foo
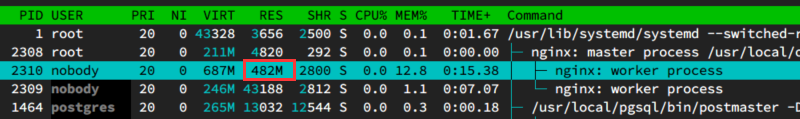
压测过程中,可以看到 Nginx 的一个 worker 的内存占用在持续上升:
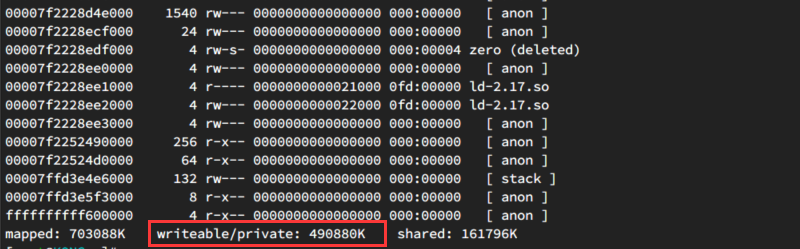
通过 pmap -d 2310 可以进一步确认实际内存占用情况:
不过现在依然无法确定到底是 OpenResty 的问题,还是 LuaJit 导致的泄漏。这里我们继续使用 lj-gc 来分析 LuaJit GC 的情况:
[root@KONG:stapxx (master)]# ./stap++ samples/lj-gc.sxx -x 2310
Found exact match for libluajit: /usr/local/openresty/luajit/lib/libluajit-5.1.so.2.1.0
Start tracing 2310 (/usr/local/openresty/nginx/sbin/nginx)
Total GC count: 194477462 bytes

[root@KONG:stapxx (master)]# ./stap++ samples/lj-gc.sxx -x 2310
Found exact match for libluajit: /usr/local/openresty/luajit/lib/libluajit-5.1.so.2.1.0
Start tracing 2310 (/usr/local/openresty/nginx/sbin/nginx)
Total GC count: 247561267 bytes

[root@KONG:stapxx (master)]# ./stap++ samples/lj-gc.sxx -x 2310
Found exact match for libluajit: /usr/local/openresty/luajit/lib/libluajit-5.1.so.2.1.0
Start tracing 2310 (/usr/local/openresty/nginx/sbin/nginx)
Total GC count: 314516362 bytes

[root@KONG:stapxx (master)]# ./stap++ samples/lj-gc.sxx -x 2310
Found exact match for libluajit: /usr/local/openresty/luajit/lib/libluajit-5.1.so.2.1.0
Start tracing 2310 (/usr/local/openresty/nginx/sbin/nginx)
Total GC count: 545262046 bytes

[root@KONG:stapxx (master)]# ./stap++ samples/lj-gc.sxx -x 2310
Found exact match for libluajit: /usr/local/openresty/luajit/lib/libluajit-5.1.so.2.1.0
Start tracing 2310 (/usr/local/openresty/nginx/sbin/nginx)
Total GC count: 601771312 bytes

[root@KONG:stapxx (master)]# ./stap++ samples/lj-gc.sxx -x 2310
Found exact match for libluajit: /usr/local/openresty/luajit/lib/libluajit-5.1.so.2.1.0
Start tracing 2310 (/usr/local/openresty/nginx/sbin/nginx)
Total GC count: 678657202 bytes
至此,可以基本确定是 LuaJit 的问题了。接下来,继续使用 lj-gc-objs 来分析 GC 的详细数据:
[root@KONG:stapxx (master)]# ./stap++ samples/lj-gc-objs.sxx -x 2310 -D MAXACTION=2000000
Found exact match for libluajit: /usr/local/openresty/luajit/lib/libluajit-5.1.so.2.1.0
Start tracing 10331 (/usr/local/openresty/nginx/sbin/nginx)

main machine code area size: 262144 bytes
C callback machine code size: 4096 bytes
GC total size: 661372355 bytes
GC state: sweep

17586 table objects: max=49184, avg=128, min=32, sum=2263784 (in bytes)
8712 cdata objects: max=12000040, avg=75403, min=12, sum=656913172 (in bytes)
7246 string objects: max=3835, avg=38, min=18, sum=276498 (in bytes)
5850 function objects: max=144, avg=28, min=20, sum=168552 (in bytes)
3960 upvalue objects: max=24, avg=24, min=24, sum=95040 (in bytes)
2605 proto objects: max=4102, avg=308, min=74, sum=802774 (in bytes)
399 thread objects: max=832, avg=742, min=424, sum=296160 (in bytes)
352 trace objects: max=8820, avg=1126, min=160, sum=396568 (in bytes)
26 userdata objects: max=28928, avg=1631, min=32, sum=42431 (in bytes)
JIT state size: 27648 bytes
global state tmpbuf size: 2048 bytes
C type state size: 16856 bytes

My GC walker detected for total 661372355 bytes.
15517 microseconds elapsed in the probe handler.
WARNING: Number of errors: 0, skipped probes: 7
可以看到 cdata 的占用极大,似乎是一个 FFI 的问题。接着使用 sample-bt-leaks 来生成火焰图,看下到底是哪个调用导致:
./stap++ samples/sample-bt-leaks.sxx -x 2310 --arg time=30 \
                 -D STP_NO_OVERLOAD -D MAXMAPENTRIES=10000 > mem.bt

../FlameGraph/stackcollapse-stap.pl mem.bt > mem.cbt

../FlameGraph/flamegraph.pl --countname=bytes --title "Memory Leak Flame Graph" mem.cbt > mem.svg
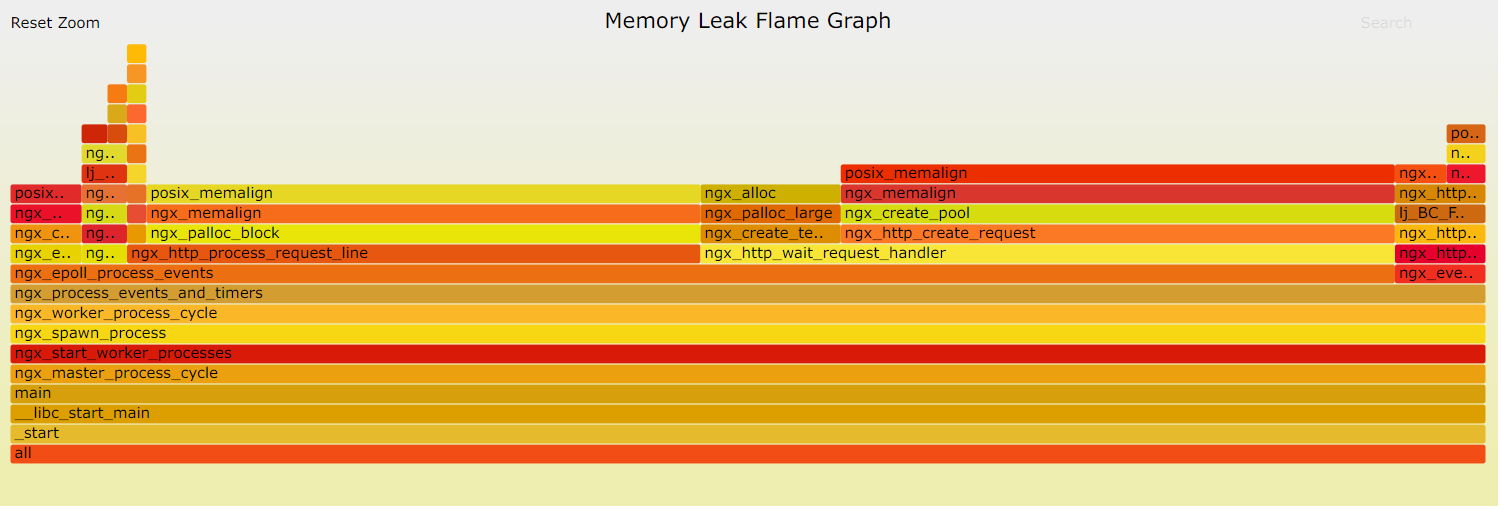
貌似并没啥异常。不过,在 bot-detection 中涉及到 FFI 调用的只有两处:
ngx.re.find用来匹配 UAresty.lrucache用来缓存 UA
然而,这个内存泄漏的问题在 Kong 1.0 中却无法复现出来。通过对比这两个版本的 bot-detection 插件源码,几乎没有什么区别,所以可以暂时断定:内存泄漏不是由 bot-detection 插件自身导致,同时也可以排除掉 ngx.re.find、resty.lrucache 自身的问题。
问题似乎走到了僵局。再次回顾 bot-detection 插件源码,看到下面这段:
local cache = ua_caches[conf]
if not cache then
  cache = lrucache.new(UA_CACHE_SIZE)
  ua_caches[conf] = cache
end
这一段的主要功能就是初始化 ua 的缓存,ua_caches 是一张 weak table。这么做的好处就是,一旦插件的 blacklist、whitelist 发生变更,那么这个 ua_caches 就会被自动 GC 掉,以降低 worker 的内存开销。
理论上,只要插件配置不做变更,在 TTL 内这个 cache 应该会一直被命中。实际上是不是这样?我们不妨来埋个点:
local cache = ua_caches[conf]
ngx.log(ngx.ERR, "cache: " .. tostring(cache), "|", "conf: " .. tostring(conf))
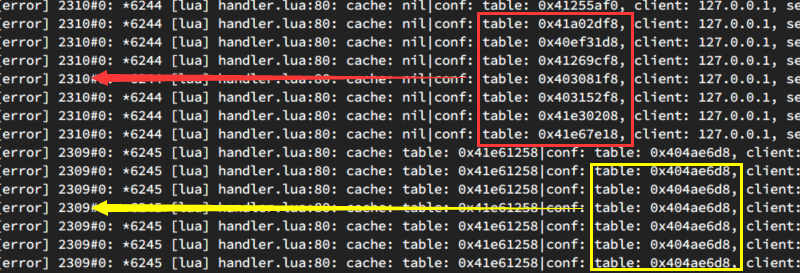
坦率的讲,当看到这个日志时,我的内心是奔溃的。原来发生泄漏的 worker 2310 缓存一直没有命中,所以一直在初始化 lrucache,导致内存泄漏。没有命中的原因就是,Kong 在每次调用插件的时候,传入的 conf 都是一个新对象(通过上图 table 的地址可以看出)。
理论上,这个 conf 应该是由 Kong 的 mlcache 缓存在 worker 的 lrucache 内,也就是在 L1 上,应该始终指向同一内存地址。这里为什么没有生效呢?通过查看 mlcache.lua 源码,问题最终定位在了这里:
local function shmlru_get(self, key)
    local v, err = self.dict:get(key)
    if err then
        return nil, "could not read from lua_shared_dict: " .. err
    end

    if v ~= nil then
        local str_serialized, value_type, at, ttl = unmarshallers.shm_value(v)

        local remaining_ttl = ttl - (now() - at)

        -- value_type of 0 is a nil entry
        if value_type == 0 then
            return set_lru(self, key, CACHE_MISS_SENTINEL_LRU, remaining_ttl)
        end

        local value, err = unmarshallers[value_type](str_serialized)
        if err then
            return nil, "could not deserialize value after lua_shared_dict " ..
                        "retrieval: " .. err
        end

        return set_lru(self, key, value, remaining_ttl)
    end
end
当请求第一次进入 worker 时,会去 L1 查找 cache,这时候不会命中,所以接着去 L2(ngx.shared.DICT)查找。查找到之后,反序列化返回并更新 L1 缓存。更新 L1 时,会计算 L1 的 TTL 时长,也就是这句 local remaining_ttl = ttl - (now() - at)。
当 Kong 配置 db_cache_ttl = 0 时,那么这个时长 remaining_ttl 将会是一个负数,这样就会导致每次更新 L1 后,L1 会立即过期。所以 L1 永远不会命中,接下来返回的始终都是反序列化后的 L2,永远都是一个新的对象。
弄清楚了这个 Bug 之后,修复起来也很简单:
local function shmlru_get(self, key)
    local v, err = self.dict:get(key)
    if err then
        return nil, "could not read from lua_shared_dict: " .. err
    end

    if v ~= nil then
        local str_serialized, value_type, at, ttl = unmarshallers.shm_value(v)

        local remaining_ttl
        if ttl == 0 then
            -- indefinite ttl, keep '0' as it means 'forever'
            remaining_ttl = 0
        else
            -- compute elapsed time to get remaining ttl for LRU caching
            remaining_ttl = ttl - (now() - at)
        end

        -- value_type of 0 is a nil entry
        if value_type == 0 then
            return set_lru(self, key, CACHE_MISS_SENTINEL_LRU, remaining_ttl)
        end

        local value, err = unmarshallers[value_type](str_serialized)
        if err then
            return nil, "could not deserialize value after lua_shared_dict " ..
                        "retrieval: " .. err
        end

        return set_lru(self, key, value, remaining_ttl)
    end
end
就是先判断 TTL 的时长,如果为 0 的话,就将 L1 设置为永不过期即可。
当然,这并不是一个完美的解决方案。因为 remaining_ttl 也有可能为 0,如果不巧这个 L2 还是一个 SENTINEL 状态,那么这个状态将会被永远缓存在 L1。鉴于篇幅原因这里不再赘述,解决方案可以参考这里:Fix expiration when the remaining TTL is exactly 0